Use the Code Playground
Run Qiskit circuits live in your browser, from editing Python to choosing a QPU and reading your results.
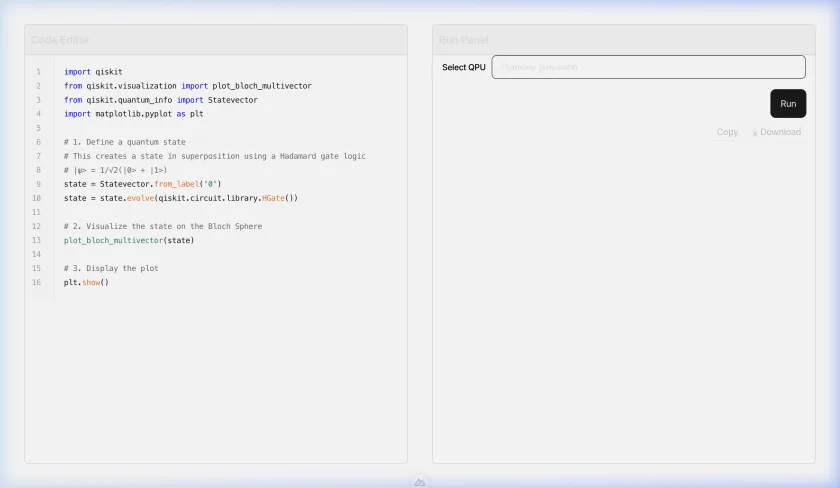
Every project on Qollab comes with a built-in code playground: a full Python and Qiskit editor that runs your circuits right in your browser, whether you are testing on a simulator or executing on real quantum hardware from IonQ. No installs, and no local environment to set up.
This guide walks you through running your code, from the editor to your first results.
Prerequisites
You need a free Qollab account (you can sign up here in seconds) and to be signed in. To follow along, open a project that already has Qiskit or Python code: any public project works, or create your own first.
Open the editor
Every project page has a Code tab, next to Project Card. Open it to find the editor, preloaded with the project's Python script. We built it to stay out of your way:
- Syntax highlighting color-codes keywords, calls, and strings so your code is easy to scan.
- Inline errors light up the line that failed, so you know exactly where to look.
- Focus mode expands the editor to fill the screen when you want no distractions. Click the fullscreen icon in the toolbar.
Switch to the runner
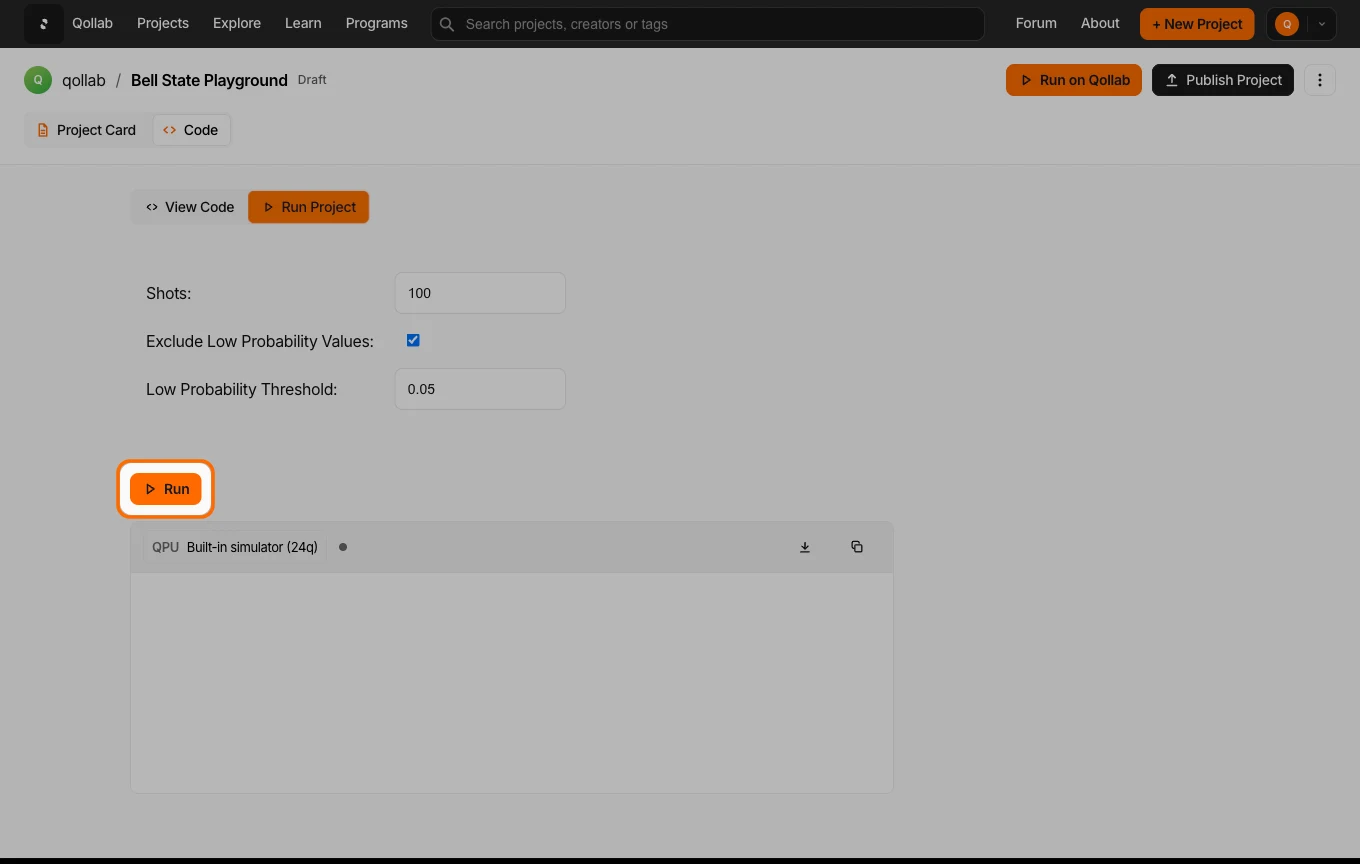
The Code tab has two modes. Click Run Project to leave the editor and open the runner, where you choose where the circuit runs and read the console. Shots are not set here: they belong in your code, on the run call, as backend.run(circuit, shots=100). Leave the argument out and the backend's own default of 1024 applies.
Choose where it runs
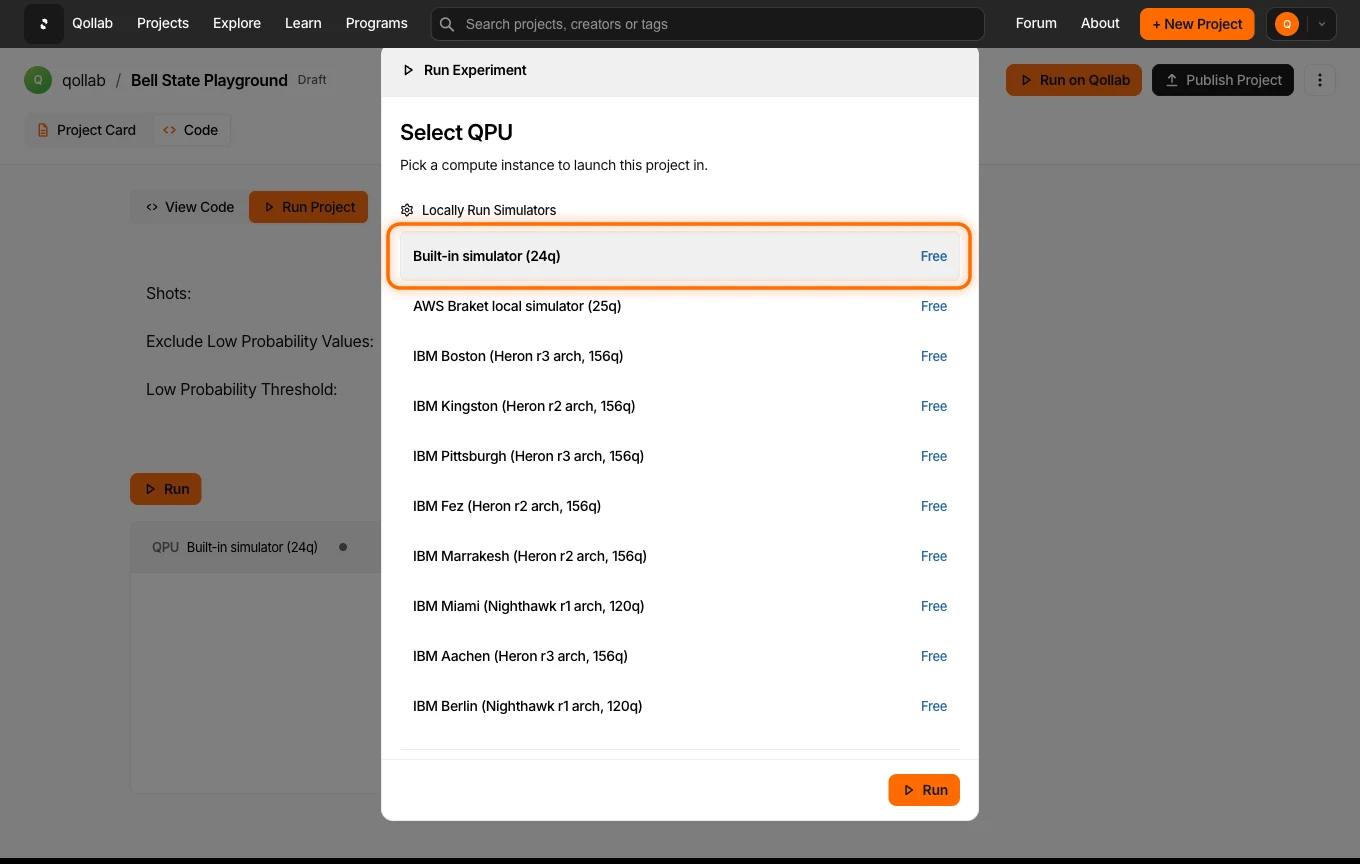
Press Run, and a Select QPU dialog opens so you can pick where the circuit executes. The options come in three groups:
- Locally run simulators are free and run inside your browser, so they start immediately and never queue. This group holds a built-in simulator, an AWS Braket local simulator, and a set of simulators that carry the noise models of IBM devices.
- Remotely run simulators are also free, but they run on IonQ's cloud instead of your browser. Each one is a noise model of a specific IonQ machine, not the machine itself. Choosing IonQ Forte 1 here runs the Forte noise model.
- Quantum Computer is the real thing: physical IonQ hardware. Runs here consume credits, and a device is only available while it is online, so you may see one listed as offline. If IonQ reports no machine at all, the group is not shown and you will see only the two simulator groups.
Compute backends lists every option in each group, with its qubit count and what it costs.
Run and read the output
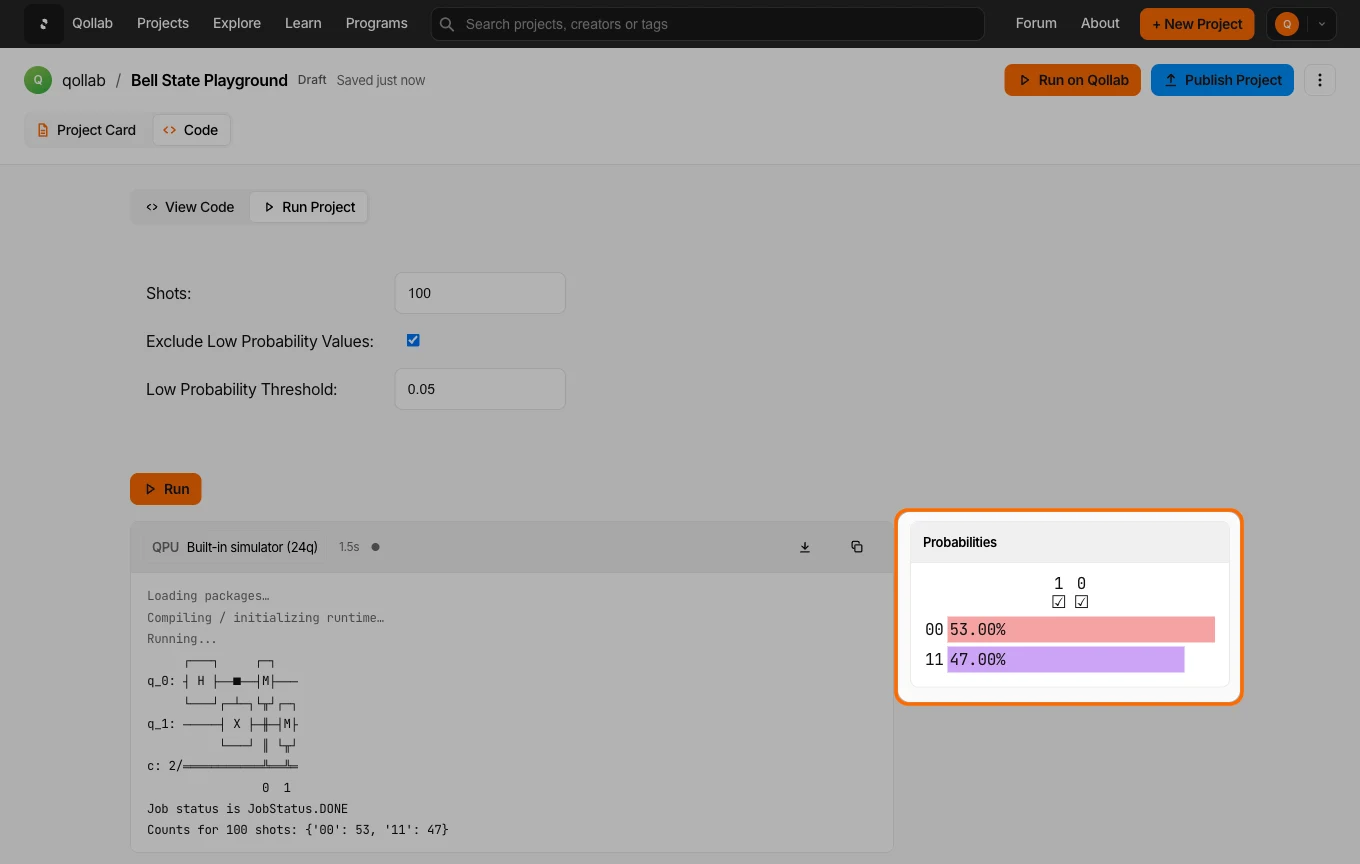
Pick your QPU and press Run in the dialog. The console tracks progress as it loads the runtime and executes, and the results land right below when it finishes. On a local simulator that is near-instant. A remote simulator runs on IonQ's cloud, so it takes longer and gets slower as you raise the shot count, and hardware jobs queue for their machine on top of that.
Here is what you can expect to see:
- Standard output: anything your
print()statements produce. - Errors: a clear red traceback pointing to the exact line, if something failed.
- Circuit and probabilities: a diagram of the circuit that ran, and a bar chart of the measurement probabilities for each outcome.
Copy or download your results
The toolbar above the console has a copy button for the console text and a download button that saves the full output as an HTML file, named with your project and a timestamp. It is a quick way to paste real results into your project write-up.
Browser compatibility
The playground needs a modern browser that supports WebAssembly JSPI, such as Chrome, Edge, or Opera. If you see a compatibility warning, switch to one of those. Firefox users can enable it manually: open about:config and set javascript.options.wasm_js_promise_integration to true.
Stay in the loop.
Get the latest tutorials, demos, and project showcases straight to your inbox. No noise, just the good stuff.
On this page